We also have the potential to increase our energy supplies (and replace existing sources) with solar, wind, thermal and water power. New batteries and better solar cells both contribute to the utility of these energy sources. But as for the rest of these items our readiness for the next surge is less certain. In particular, and as always, there are factors that work against a successful deployment–these are the reactionary and vested interests that are being creatively destroyed or disrupted, not to mention backlash in the cultural arena. These are not insignificant:
- We have long had a streak of anti-intellectualism in the U.S. that surfaces persistently in religion (e.g., creationism), climate change (“no scientific proof”), and political ideology (bashing technocratic elites). These typically led by vested interests who hold these views (religious fundamentalists), or who cynically play to them in order to maintain power (today’s populists, primarily within the Republican Party).
- Our education system performs well below the average of other developed countries, and we have a strong movement to privatize and theologize, that is to further splinter, public education, once one of America’s great strengths. Vested interests may favor technical education (to staff their organizations), but they don’t like liberal arts colleges that foster critical or creative thinking, which unfortunately are necessary to drive innovation.
- Another wave of anti-immigration sentiment threatens to choke off a major source of innovation. Immigrants founded 52 percent of new Silicon Valley companies between 1995 and 2005, and a 2016 report showed that 44 out of 87, (51%) of the country’s $1 billion startup companies had at least one immigrant founder.
- The federal government appears about to go on another quixotic quest to cut taxes, restore manufacturing jobs, and de-regulate everything despite 30 years of evidence that none of those policies work. It’s no accident that fossil fuel and speculative banking interests dominate the current U.S. federal administration. Oil and gas drove the last (4th ) surge and financial capital drove the installation period of the 5th They want to stay in control.
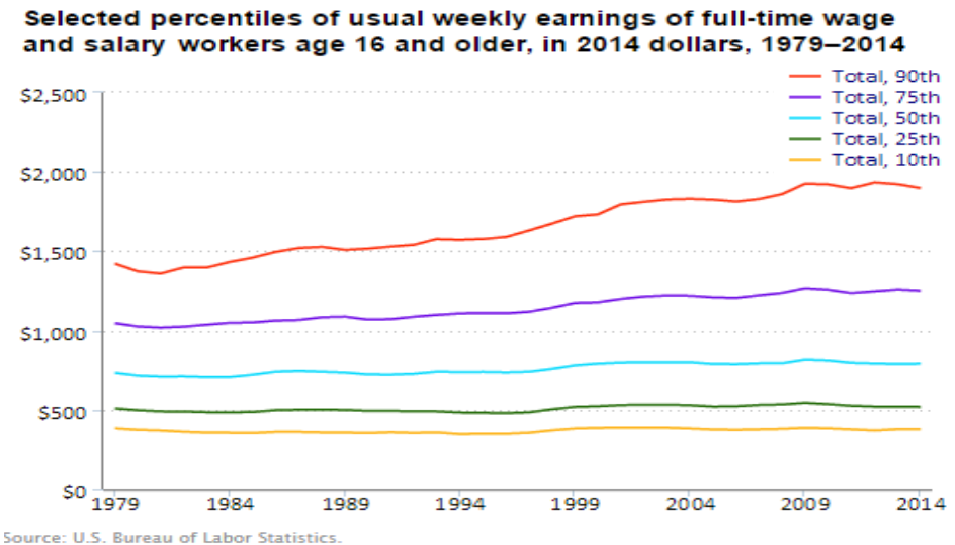
- The mass market that powered the great post-war surge stopped growing 40 years ago. (See wage chart below (22).) Unfortunately, broad-based surges need a large market, and the stagnation of incomes was a natural part of the installation phase of the current surge. The issue is where the market for the deployment phase of the next surge will come from if U.S. incomes remain stagnant.
Remember, nothing is pre-determined: leading nations benefit from surges that begin in their economies, but they don’t necessarily lead the next surge. In the 15th century the Chinese built an immense navy and established trade routes throughout the South China Sea and the Indian Ocean, but after the emperor died, the new ruler chose to focus on building the Great Wall (sound familiar?) and by 1500 the navy was no more. (23) The Portuguese, the Dutch, and eventually the British assumed leadership in South Asia instead. Similarly, the British led the first two surges based on water power and coal, but they did not lead thereafter, because they chose to pursue larger and quicker profits in the empire instead of investing in the home economy. (23) Thus, Germany and the U.S. invested in and took leadership in steel, petrochemicals, and the electrical industry.
As Perez points out: “all technology provides is a substantial—and specific—potential for wealth creation in a range of possible directions.” (24) The last wave—the automobile, oil, petrochemicals and mass production—supported three different economic regimes: Nazi autarky (economic self-sufficiency), Soviet communism, and Keynesian capitalism. Selection of a specific course for each economic surge is not solely a market task. It also depends on political leadership. As Perez says, “The capacity of politicians and policy makers to understand what is really at stake will determine the success or failure in controlling finance, favoring the flourishing of production and employment, and benefitting the great majorities of the population.” (24, p. 214)
For policy makers the key insight is that this direction is neither pre-determined nor automatically defined by the technologies….Historically it has resulted from a combination of factors: the constellation of lifestyle-shaping goods and services made possible by the technologies; the ability of investors, entrepreneurs and governments to recognize the potential of these products; the political ideologies of those with the power to affect their deployment; and the socio-historical context in which they emerge. (25)
Global green surge next?
Perez has identified a potential huge opportunity for shaping and leading the next big surge. Specifically, she advocates a “green” direction that converts the environmental crisis from an economic problem into an economic opportunity. (25, p. 15) “’Green growth’ also supposes the return—and heightened importance–of product durability, accompanied by maintenance as a key service.” (25, p. 18)
This could then lead to a very active rental sector for organizing second, third and Nth hand markets in each country and across the world, along with the growth of disassembly, remanufacturing, recycling, reusing and other materials-saving processes. Information for 3-D printing replacement parts and the provision of regular upgrades for the maintenance of products could become standard practice….In the advanced world, such a business strategy would create great quantities of jobs for displaced assembly workers in maintenance, upgrading, warehousing, parts ‘printing’, distribution and installation; while design, redesign and many other creative industries and service would employ young university graduates. A ‘green mission’ would thus be equivalent to the combination of post-war reconstruction, the Cold War and suburbanization in terms of demand creation, employment and directionality for innovation. (25, p. 19)
This strategy would reverse the current growth of income inequality, which is typical of the deployment stage of a surge, and it would extend a new, sustainable version of the “American way of life” to the rest of the world. However, both government and classical economics must recognize that “the battle is not between state and markets; it is between policies that will maintain uncertain growth and increasing income inequality and a direction that can bring a sustainable global golden age that can lift all boats.” (25, p. 23)
Perez’s green path is probably too optimistic, but it could lead to faster automation of existing work, but–as is typical with technological revolutions—the nature of work will change to create new jobs and huge new global mass markets will multiply those jobs. New jobs in new organizations will be the easiest to automate since the job design and human-machine interface can be built from scratch. Automation of existing work and re-design of existing jobs will still be slow in most cases, but maybe we’ll eventually be able to automate the design and construction of user interfaces, too.
So, have we answered our question? How quickly will we automate most existing work?
We demonstrated that job automation cannot be analyzed in isolation. If Perez is correct, there is a potentially positive path to a new economic surge that would speed up job automation, and much else. However, the current American leadership’s calamitous reactionary junket appears bent on squandering that opportunity. Indeed, without a significant change in course, chaos and an economic depression seem a more likely outcome in the U.S. than a green global golden age. Even if, by some miracle, we are able to dodge most of the devastating impact of environmental change, America is on course to surrender its position as the leading economy to a hungrier and more rationally led nation. China, for example, might be able to pick up the baton and lead the next surge, just as the U.S. took the lead from the U.K. while the British focused on quick profits in the empire during the last half of the 19th century.
References
- http://www.mckinsey.com/business-functions/digital-mckinsey/our-insights/where-machines-could-replace-humans-and-where-they-cant-yet
- https://www.nytimes.com/2017/01/12/technology/robots-will-take-jobs-but-not-as-fast-as-some-fear-new-report-says.html?_r=0
- World Development Report 2016, World Bank, p. 23.
- http://www.oxfordmartin.ox.ac.uk/downloads/academic/The_Future_of_Employment.pdf
- http://www.economist.com/news/special-report/21700758-will-smarter-machines-cause-mass-unemployment-automation-and-anxiety
- http://www.marketwatch.com/story/trump-labor-secretary-pick-andy-puzder-talked-about-replacing-workers-with-robots-2016-12-08
- https://hbr.org/2013/04/change-management-needs-to-cha
- http://blogs.gartner.com/thomas_bittman/2015/02/05/why-are-95-of-private-clouds-failing/
- http://www.cio.com/article/2402706/enterprise-resource-planning/employees-refusing-to-use-clunky-enterprise-software.html
- https://www.bls.gov/lpc/special_requests/nonfarm_business.zip
- https://www.theguardian.com/society/2013/sep/18/nhs-records-system-10bn; http://spectrum.ieee.org/riskfactor/aerospace/military/the-us-air-force-explains-its-billion-ecss-bonfire; http://astro.temple.edu/~wurban/Case%20Studies/HP’s%20ERP%20Failure.pdf
- https://www.bea.gov//national/nipaweb/GetCSV.asp?GetWhat=SS_Data/SectionAll_xls.zip&Section=11 (1969-2016)
- https://www.bea.gov//national/nipaweb/GetCSV.asp?GetWhat=SS_Data/SectionAll_xls_Hist.zip&Section=11 (pre-1969)
- https://en.wikipedia.org/wiki/Creative_destruction
- As Time Goes By, Chris Freeman and Francisco Louçã, 2001, pp. 369-70.
- From the Bureau of Economic Analysis reported in “US Manufacturing: Understanding Its Past and Its Potential Future,” Martin Neil Baily and Barry P. Bosworth, Journal of Economic Perspectives, Winter 2014, pp. 3-26.
- http://majentaplm.com/events/industry-4-0-is-your-business-ready-for-the-next-industrial-revolution/
- “Energy, K-waves, Lead Economies, and Their Interpretation/Implications,” William R. Thompson in Kondratieff Waves: Dimensions and Prospects at the Dawn of the 21st Century, ed. Leonid E. Grinin, Tessaleno C Devezas, and Andrey V. Korotayev, 2012.
- “Technological Revolutions and the Role of Government in Unleashing Golden Ages,” Carlota Perez in Kondratieff Waves, 2012, pp. 211-218.
- “Deep Transitions: Emergence, Acceleration, Stabilization and Directionality,” Johan Schot and Laur Kanger, Science Policy Research Unit Working Paper Series, University of Sussex, September 2016.
- “Top 10 Emerging Technologies of 2016,” World Economic Forum’s Meta-Council on Emerging Technologies, June 2016.
- “A Look At Pay At The Top, The Bottom, And In Between,” U.S. Bureau of Labor Statistics, May 2015, p. 2.
- The Origins of the Modern World, Robert B. Marks, 2015, pp. 42-45.
- “The Advance of Technology and Major Bubble Collapses: Historical Regularities and Lessons for Today,” Carlota Perez at the Engelsberg Seminar in Sweden, June 2010.
- “Capitalism, Technology and a Green Golden Age: The Role of History in Helping to Shape the Future,” Carlota Perez, working paper in Beyond the Technological Revolution (beyondthetechrevolution.com), April 2016, p. 9.