Big political transactions

The network graph below shows a portion of the major transactions between political committees for 2021-22 based on Federal Elections Commission data.

You can load an interactive version of the image here:

https://docs.google.com/document/d/1AJCjbdB4wRfrp6QJDlPxIr9qMahDRF9zSepERrZMsyU/edit?usp=sharing

It may take a while to load, but once loaded you can move around in it (by clicking your left mouse button and holding it down as you move it), and you can scroll to make it larger or smaller. The nodes are committees (which when enlarged are labeled), and the arrows between nodes illustrate how large the transaction was by the width of the arrow. The skinniest arrows are $1 million.

Does 265 = 117,256?

In the 2022 federal congressional elections, 265 people donated $859,860,994, while 117,256 people donated $721,920,887.

Overall, 2,228 donors gave $2,476,618,394 in single donations of $100,000 or more. All donations of $2,000 or more totaled only $4,060,112,850.

All these numbers cover the period from Jan. 1 to Dec.31, 2022 as reported by the Federal Election Commission.

How bad will it be?

If you’ve ever wondered what the world will be like for your children, you probably know something about climate change.

You know it will be warmer, right?  More storms, heavier rain.  Droughts, more fires.

Sounds grim, but it’s pretty abstract.  Probably won’t affect my kids.

Let’s make it a little more real.  Based on the latest research, these are the kinds of things that could happen—soon:

YearIncident
2023Greenland ice melt continues to increase.
 Wildfires destroy record acreage.
 Atlantic Meridional Overturning Circulation (AMOC) grows more erratic.
 July land surface temperature reaches 1.61° C above 20th century average in U.S.
 Air quality below EPA standards across 80% of U.S.
 Drought in northwest and southwest U.S. continues.
 Agriculture production in California is 15% below 21st century average.
 Actions of many wealthy nations—including the U.S.—are still consistent with a greater than 3° C warming.
 Droughts intensify in northern Argentina and South Africa.
 Global land surface temperature for 2023 reaches 1.52° C above the average for the 20th century.
2024Drought extends from Great Plains through Indiana and southern Michigan for a second year.
 IPCC projects that the remaining carbon budget with a 50% chance to stay under 1.5° C is down to 250 Gt.  Global emissions in 2023 were 46 Gt.
 Corn production is 16% below 21st century average due to resurgence of corn borer.
 Power outages affect as many as 50% of households in Arizona and southern California.
 Drought in northern Mexico continues.
 Mexico requests food aid from the U.S.
 Dengue fever outbreaks occur in Tennessee and Maryland.
 Record ten hurricanes make landfall in the U.S.—three in the Gulf, five in the southeast, and two in the northeast.  Estimated property damage exceeds $350 billion.
 Philippines hit with a category 5 typhoon: winds of 160 mph.  Death toll estimated at over 100,000.
 Florida trucks fresh water to Dade County for six months after record storm surge disrupts normal supply.
 Flash floods claim 1,826 lives for the year.  Estimated property and infrastructure damage exceeds $50 billion.
2025Insect damage to Rocky Mountain forests from Colorado to Montana at worst level ever.
 July land surface temperature reaches 1.72° C above 20th century average in U.S.
 Hurricane Donald comes ashore at Galveston, which is totally flooded and 80% destroyed.  Heavy rainfall floods 40% of Houston.
 Grain production—wheat, corn, soybeans–in the U.S. is 25% below 21st century average.
 Lake Mead falls below 1,000 feet above sea level, 25 feet below the level of the last agreement on water rights.
 Further cuts in electricity generation.  More fighting about who gets water.
 U.S. unable to meet Mexico’s new food aid requests.

Given that our forecasts of the scale and the rate of change have routinely been too optimistic, it could be worse.  Certainly, it will be later:

YearIncident
2026Atmospheric river dumps up to 18 inches of rain in four days over the Sacramento and San Joaquin valleys causing widespread flooding—nearly as bad as the Great Flood of 1862.
 Sea level rise for the previous 10 years doubles from 20th century average.
 Antarctica ice melt speeds up.
 Large areas of northwestern Netherlands flood, displacing over half a million people.
 Dead zones appear off the California coast due to ocean acidification and de-oxygenation.
 Over 50% of the coral reefs in the U.S. Virgin Islands die.
 Wildfires again destroy record acreages in the western states.
2027Snowpack in California at lowest level ever recorded.
 Colorado River water flow lowest in recorded history.
 Construction begun on massive pipeline to move Mississippi water to U.S. southeast.  Project expected to take 10 years.
 Arctic Sea virtually ice free years ahead of projections.
 Almost 90% of Great Barrier reef is dead.
 Arizona and New Mexico truck water to native American communities throughout both states.
 U.S. Department of Agriculture reports that 14 invasive plant species are now resistant to all commercially available pesticides.
 Chile institutes water rationing in all major cities as freshwater run-off from Andes glaciers falls to 30% of 20th century average.
 Flash floods claim 3,478 lives for the year.
 Heat waves estimated to have caused 15,000 excess deaths in U.S. cities.
2028Melting of Antarctic ice has doubled since 2020.  Probability of two-meter sea level rise by 2100 put at 50%.
 July land surface temperature reaches 1.79° C above 20th century average in U.S.
 The U.N. reports that 83 million people were refugees world-wide.  Over 10 million were from Bangladesh alone.
 Hurricane floods Mobile, Alabama, and neighboring coastal areas.
 Cost of property insurance has increased 300% for property within 50 miles of the southeastern and Gulf coasts.
 Trumpist candidate elected president.
2029U.S. withdraws from all U.N. climate change initiatives and all refugee programs.
 EPA rescinds all restrictions on greenhouse gas emissions.
 President stops Mississippi River water project, claiming federal government shouldn’t subsidize California agriculture.
 Category 5 hurricane hits Savannah, Georgia.  Over 1,800 die, mostly in the storm surge.
 Federal government places caps on disaster aid per incident and per state.
 India invades Nepal over water dispute.
 Arizona takes water from the Colorado that belongs to California.
 Flash floods claim 6,718 lives for the year.
 Greenland ice melt sets record.
2030Wildfires, insects, and disease have reduced U.S. forests’ ability to capture CO2 by 40%.
 AMOC has clearly stopped.
 France reports its insect population has fallen by 70% since 2000.
 California farmers take control of dams and aqueducts.
 Presidential order restricts reporting on climate change effects to protect national security.  Supreme Court upholds the order.

Objects are not as close–part 3

We also have the potential to increase our energy supplies (and replace existing sources) with solar, wind, thermal and water power.  New batteries and better solar cells both contribute to the utility of these energy sources.  But as for the rest of these items our readiness for the next surge is less certain.  In particular, and as always, there are factors that work against a successful deployment–these are the reactionary and vested interests that are being creatively destroyed or disrupted, not to mention backlash in the cultural arena.  These are not insignificant:

  • We have long had a streak of anti-intellectualism in the U.S. that surfaces persistently in religion (e.g., creationism), climate change (“no scientific proof”), and political ideology (bashing technocratic elites). These typically led by vested interests who hold these views (religious fundamentalists), or who cynically play to them in order to maintain power (today’s populists, primarily within the Republican Party).
  • Our education system performs well below the average of other developed countries, and we have a strong movement to privatize and theologize, that is to further splinter, public education, once one of America’s great strengths. Vested interests may favor technical education (to staff their organizations), but they don’t like liberal arts colleges that foster critical or creative thinking, which unfortunately are necessary to drive innovation.
  • Another wave of anti-immigration sentiment threatens to choke off a major source of innovation. Immigrants founded 52 percent of new Silicon Valley companies between 1995 and 2005, and a 2016 report showed that 44 out of 87, (51%) of the country’s $1 billion startup companies had at least one immigrant founder.
  • The federal government appears about to go on another quixotic quest to cut taxes, restore manufacturing jobs, and de-regulate everything despite 30 years of evidence that none of those policies work. It’s no accident that fossil fuel and speculative banking interests dominate the current U.S. federal administration.  Oil and gas drove the last (4th ) surge and financial capital drove the installation period of the 5th  They want to stay in control.
  • The mass market that powered the great post-war surge stopped growing 40 years ago. (See wage chart below (22).)  Unfortunately, broad-based surges need a large market, and the stagnation of incomes was a natural part of the installation phase of the current surge.  The issue is where the market for the deployment phase of the next surge will come from if U.S. incomes remain stagnant.

Wages 1979-2014 cropped

Remember, nothing is pre-determined: leading nations benefit from surges that begin in their economies, but they don’t necessarily lead the next surge.  In the 15th century the Chinese built an immense navy and established trade routes throughout the South China Sea and the Indian Ocean, but after the emperor died, the new ruler chose to focus on building the Great Wall (sound familiar?) and by 1500 the navy was no more. (23)  The Portuguese, the Dutch, and eventually the British assumed leadership in South Asia instead.  Similarly, the British led the first two surges based on water power and coal, but they did not lead thereafter, because they chose to pursue larger and quicker profits in the empire instead of investing in the home economy. (23)  Thus, Germany and the U.S. invested in and took leadership in steel, petrochemicals, and the electrical industry.

As Perez points out: “all technology provides is a substantial—and specific—potential for wealth creation in a range of possible directions.” (24)  The last wave—the automobile, oil, petrochemicals and mass production—supported three different economic regimes: Nazi autarky (economic self-sufficiency), Soviet communism, and Keynesian capitalism.  Selection of a specific course for each economic surge is not solely a market task.  It also depends on political leadership.  As Perez says, “The capacity of politicians and policy makers to understand what is really at stake will determine the success or failure in controlling finance, favoring the flourishing of production and employment, and benefitting the great majorities of the population.” (24, p. 214)

For policy makers the key insight is that this direction is neither pre-determined nor automatically defined by the technologies….Historically it has resulted from a combination of factors: the constellation of lifestyle-shaping goods and services made possible by the technologies; the ability of investors, entrepreneurs and governments to recognize the potential of these products; the political ideologies of those with the power to affect their deployment; and the socio-historical context in which they emerge. (25)

Global green surge next?

Perez has identified a potential huge opportunity for shaping and leading the next big surge.  Specifically, she advocates a “green” direction that converts the environmental crisis from an economic problem into an economic opportunity. (25, p. 15) “’Green growth’ also supposes the return—and heightened importance–of product durability, accompanied by maintenance as a key service.” (25, p. 18)

This could then lead to a very active rental sector for organizing second, third and Nth hand markets in each country and across the world, along with the growth of disassembly, remanufacturing, recycling, reusing and other materials-saving processes.  Information for 3-D printing replacement parts and the provision of regular upgrades for the maintenance of products could become standard practice….In the advanced world, such a business strategy would create great quantities of jobs for displaced assembly workers in maintenance, upgrading, warehousing, parts ‘printing’, distribution and installation; while design, redesign and many other creative industries and service would employ young university graduates.  A ‘green mission’ would thus be equivalent to the combination of post-war reconstruction, the Cold War and suburbanization in terms of demand creation, employment and directionality for innovation. (25, p. 19)

This strategy would reverse the current growth of income inequality, which is typical of the deployment stage of a surge, and it would extend a new, sustainable version of the “American way of life” to the rest of the world.  However, both government and classical economics must recognize that “the battle is not between state and markets; it is between policies that will maintain uncertain growth and increasing income inequality and a direction that can bring a sustainable global golden age that can lift all boats.” (25, p. 23)

Perez’s green path is probably too optimistic, but it could lead to faster automation of existing work, but–as is typical with technological revolutions—the nature of work will change to create new jobs and huge new global mass markets will multiply those jobs.  New jobs in new organizations will be the easiest to automate since the job design and human-machine interface can be built from scratch.  Automation of existing work and re-design of existing jobs will still be slow in most cases, but maybe we’ll eventually be able to automate the design and construction of user interfaces, too.

So, have we answered our question?  How quickly will we automate most existing work?

We demonstrated that job automation cannot be analyzed in isolation.  If Perez is correct, there is a potentially positive path to a new economic surge that would speed up job automation, and much else.  However, the current American leadership’s calamitous reactionary junket appears bent on squandering that opportunity.  Indeed, without a significant change in course, chaos and an economic depression seem a more likely outcome in the U.S. than a green global golden age.  Even if, by some miracle, we are able to dodge most of the devastating impact of environmental change, America is on course to surrender its position as the leading economy to a hungrier and more rationally led nation.  China, for example, might be able to pick up the baton and lead the next surge, just as the U.S. took the lead from the U.K. while the British focused on quick profits in the empire during the last half of the 19th century.

References

  1. http://www.mckinsey.com/business-functions/digital-mckinsey/our-insights/where-machines-could-replace-humans-and-where-they-cant-yet
  2. https://www.nytimes.com/2017/01/12/technology/robots-will-take-jobs-but-not-as-fast-as-some-fear-new-report-says.html?_r=0
  3. World Development Report 2016, World Bank, p. 23.
  4. http://www.oxfordmartin.ox.ac.uk/downloads/academic/The_Future_of_Employment.pdf
  5. http://www.economist.com/news/special-report/21700758-will-smarter-machines-cause-mass-unemployment-automation-and-anxiety
  6. http://www.marketwatch.com/story/trump-labor-secretary-pick-andy-puzder-talked-about-replacing-workers-with-robots-2016-12-08
  7. https://hbr.org/2013/04/change-management-needs-to-cha
  8. http://blogs.gartner.com/thomas_bittman/2015/02/05/why-are-95-of-private-clouds-failing/
  9. http://www.cio.com/article/2402706/enterprise-resource-planning/employees-refusing-to-use-clunky-enterprise-software.html
  10. https://www.bls.gov/lpc/special_requests/nonfarm_business.zip
  11. https://www.theguardian.com/society/2013/sep/18/nhs-records-system-10bn; http://spectrum.ieee.org/riskfactor/aerospace/military/the-us-air-force-explains-its-billion-ecss-bonfire; http://astro.temple.edu/~wurban/Case%20Studies/HP’s%20ERP%20Failure.pdf
  12. https://www.bea.gov//national/nipaweb/GetCSV.asp?GetWhat=SS_Data/SectionAll_xls.zip&Section=11 (1969-2016)
  13. https://www.bea.gov//national/nipaweb/GetCSV.asp?GetWhat=SS_Data/SectionAll_xls_Hist.zip&Section=11 (pre-1969)
  14. https://en.wikipedia.org/wiki/Creative_destruction
  15. As Time Goes By, Chris Freeman and Francisco Louçã, 2001, pp. 369-70.
  16. From the Bureau of Economic Analysis reported in “US Manufacturing: Understanding Its Past and Its Potential Future,” Martin Neil Baily and Barry P. Bosworth, Journal of Economic Perspectives, Winter 2014, pp. 3-26.
  17. http://majentaplm.com/events/industry-4-0-is-your-business-ready-for-the-next-industrial-revolution/
  18. “Energy, K-waves, Lead Economies, and Their Interpretation/Implications,” William R. Thompson in Kondratieff Waves: Dimensions and Prospects at the Dawn of the 21st Century, ed. Leonid E. Grinin, Tessaleno C Devezas, and Andrey V. Korotayev, 2012.
  19. “Technological Revolutions and the Role of Government in Unleashing Golden Ages,” Carlota Perez in Kondratieff Waves, 2012, pp. 211-218.
  20. “Deep Transitions: Emergence, Acceleration, Stabilization and Directionality,” Johan Schot and Laur Kanger, Science Policy Research Unit Working Paper Series, University of Sussex, September 2016.
  21. “Top 10 Emerging Technologies of 2016,” World Economic Forum’s Meta-Council on Emerging Technologies, June 2016.
  22. “A Look At Pay At The Top, The Bottom, And In Between,” U.S. Bureau of Labor Statistics, May 2015, p. 2.
  23. The Origins of the Modern World, Robert B. Marks, 2015, pp. 42-45.
  24. “The Advance of Technology and Major Bubble Collapses: Historical Regularities and Lessons for Today,” Carlota Perez at the Engelsberg Seminar in Sweden, June 2010.
  25. “Capitalism, Technology and a Green Golden Age: The Role of History in Helping to Shape the Future,” Carlota Perez, working paper in Beyond the Technological Revolution (beyondthetechrevolution.com), April 2016, p. 9.


Objects are not as close–part 2

Really?  Great surges?

Evolutionary economists take a finer grained approach to describing change than the industrial revolutions identified by traditional economists.  Instead they identify waves or surges of growth and change so that the First Industrial Revolution, for instance, encompasses two waves, one based on water power and one based on coal and steam.  In this case, both waves started with the use of machines in textile production and then spread to transportation (canals first and then railroads) and both were in Britain, so they tended to be lumped together in traditional economic descriptions even though they were separated by several decades.  The idea of economic waves was first proposed by Nikolai Kondratiev in 1922 and later picked up by Schumpeter, but their analyses were incomplete.  Only in the last 20 years were these ideas fully enough developed to explain broad swaths of economic history.

Thompson chart p196

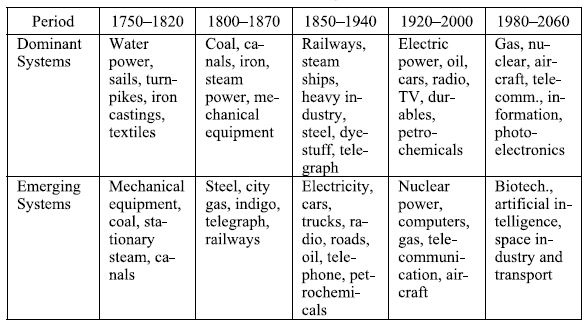
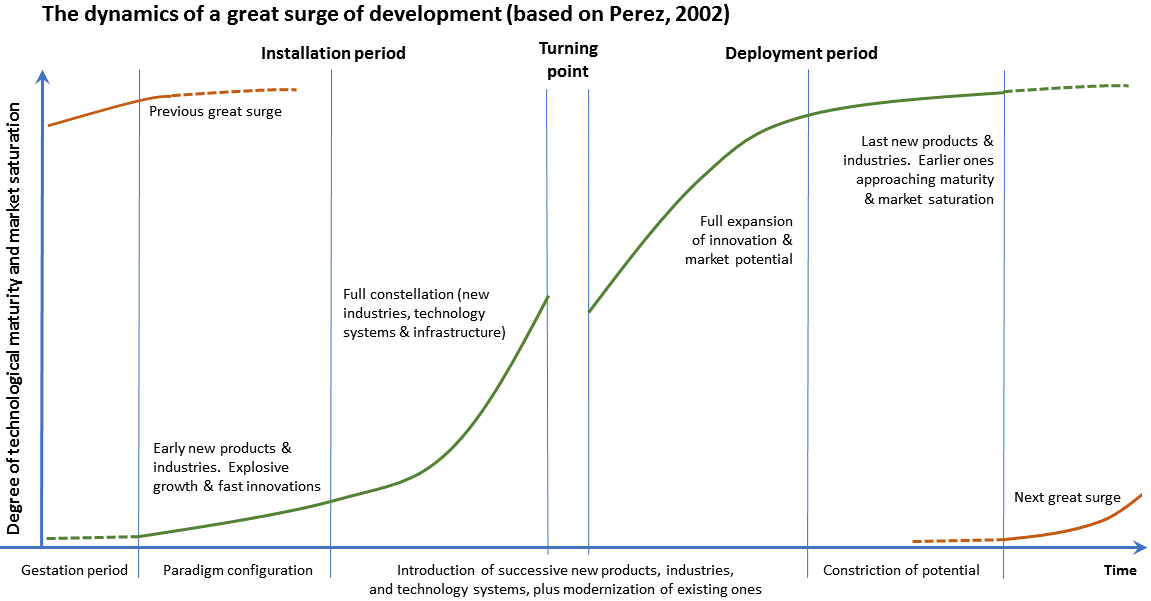
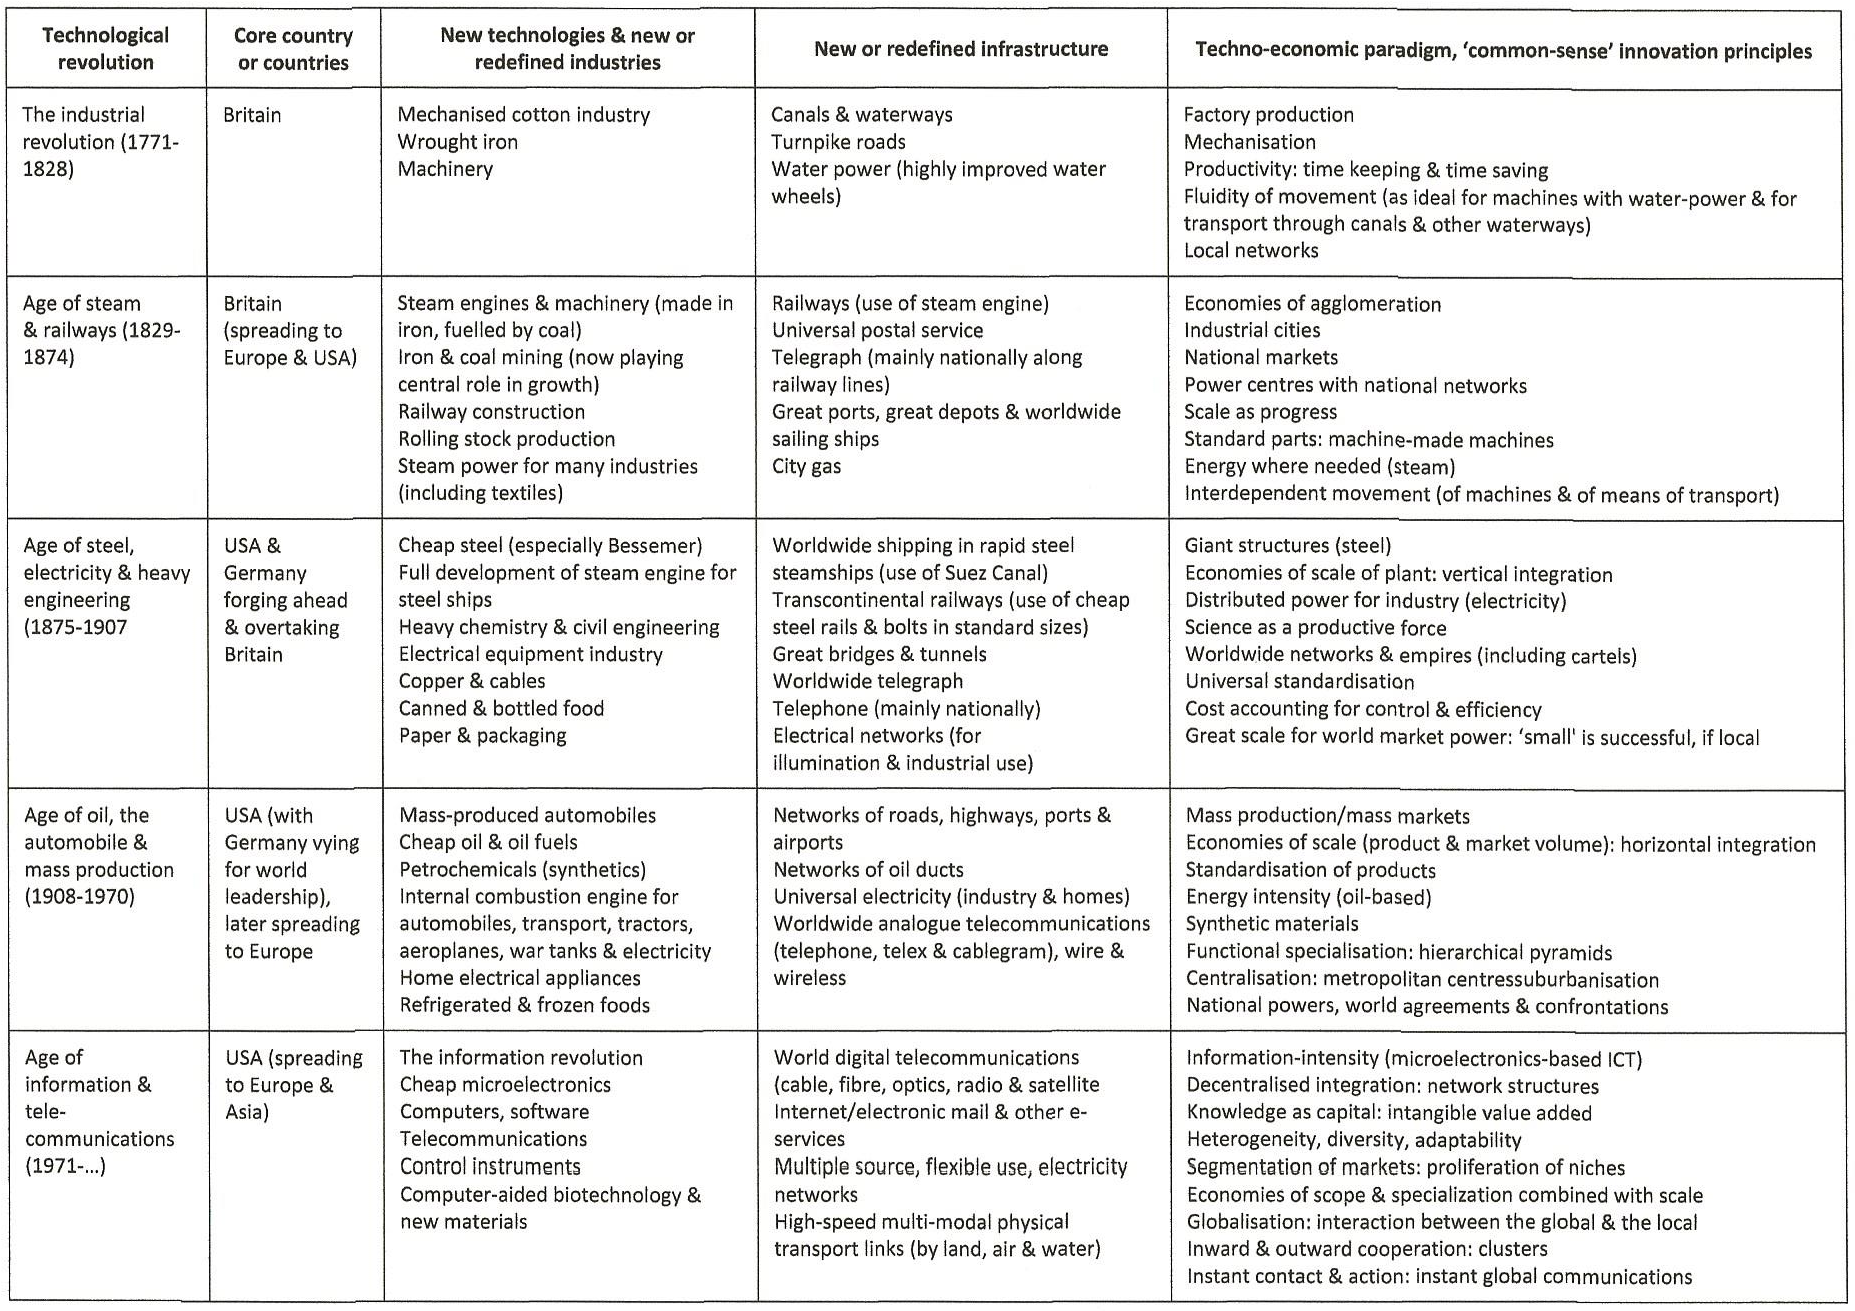
Economic surges, particularly those in the last 350 years, possess certain defining characteristics.  First, each surge coincides with the appearance of a new and greater source of energy and a set of innovations which take particular advantage of the new power source (or just of the availability of more energy) to create much new wealth.  The wave appears first in one leading economy, such as the U.K. or the U.S., and unfolds in stages.  (See diagram below).  The initial stage, called the installation period, begins during the previous surge as a new techno-economic paradigm forms.

Surge images v4 cropped

Each surge is powered by speculative financial capital, and a few people and industries accumulate very great wealth during the installation period of a surge.  As the change spreads, the labor force, and society as a whole, adapts–that is, they move into new jobs, though not docilely.  In each surge, there is typically a speculative bubble and a collapse, as well as significant internal and international strife, strikes, trade wars, and real war. For example, in the third wave we saw the rise of the robber barons—Andrew Carnegie in steel, J.B. Duke in tobacco, Jay Gould in railroads, Andrew Mellon in aluminum, J.P. Morgan in mergers, John D. Rockefeller in oil—and then the big anti-trust laws in 1890 and 1914.  The later part of this wave saw the formation of industrial unions and their final success after the 1920’s real estate bubble burst and the Great Depression set in.  World War I and II both had roots in the third wave, and the second war, with its huge government sponsored industrial expansion, launched the great post-war boom of the fourth wave.  But again, typically, as societal wealth grows more rapidly in the deployment phase, the political system negotiates a more equitable distribution of the economic gains, and tensions subside.

Leading sector timing and indicators, 15th to 21st centuries
Lead economy Leading sector Start-up phase

(installation)

High growth phase

(deployment)

Portugal Guinea gold 1430-460 1460-1494
Indian pepper 1494-1516 1516-1540
Netherlands Baltic, Atlantic trade 1540-1560 1560-1580
Eastern trade 1580-1609 1609-1640
Britain Amerasian trade (sugar) 1640-1660 1660-1688
Amerasian trade 1688-1713 1713-1740
Britain Cotton, iron 1740-1763 1763-1792
Railroads, steam 1792-1815 1815-1850
United States Steel, chemicals, electronics 1850-1873 1873-1914
Motor vehicles, aviation, electronics 1914-1945 1945-1973
United States Information industries 1973-2000 2000-20??
?? Artificial intelligence, biotech ?? ??

Are we ready for another surge?

Although the waves have similarities, they are obviously not identical, and the outcome of each wave is not pre-determined.  Nor is the leading economy guaranteed permanent success.  Portugal and the Netherlands had a turn before the British, and the U.S. succeeded the U.K.  Carlota Perez, one of the leading contemporary ‘wave’ theorists, argues that the next surge could be a “green” one, powered by renewable energy, closed loop resourcing, and the rise of several billion people into mass consumption lifestyles.  If her vision comes to pass, it has the added promise of heading off the catastrophe posed by climate change—which would likely destroy any surge that doesn’t address it.  For the sake of the current discussion, if not for our mental health, let’s assume that we will find a way to head off a climate catastrophe.   How are we doing in setting the stage for another rapid economic surge that will generate a rapid automation of existing work?

Five Great Surges of Development (according to Perez)

Schot-Sanger chart

Typically, according to Perez, each surge begins with a period driven by financial capital searching for new ways to make money when the technologies of the previous wave can no longer drive large profits.  This search by unfettered finance drives a bubble prosperity that inevitably collapses into a recession or worse.  This first phase, which Perez calls the “installation phase,” is characterized by growing income inequality.  (Remember the robber barons?  How about Larry Ellison, Bill Gates, Peter Thiel?)  Dissatisfaction with the inequality and the collapse allow governments to chart a course for the next surge of growth, which Perez calls the “deployment phase.” (20)

Perez describes the last complete two-phase growth surge:

In 1908, Ford’s model-T inaugurated the Age of the Automobile and Mass Production in the United States.  The great crash of 1929 ended the Roaring Twenties frenzy and led to the longest post-collapse recessive period to date: the 1930s.  Resistance to the New Deal may be seen as one of the root causes of the prolonged stagnation.  It took the experience of government-industry collaboration during World War II to enable acceptance of the full Welfare State and the Keynesian policies and institutions that facilitated the greatest economic boom in history.  (19, p.213)

The post-war boom petered out in the 1970s and a new installation period based on information, computers, and telecommunications began.  Bubbles based on the Internet and on complex, computerized financial instruments collapsed in 2001 and 2008.  Thus, we should be primed for another economic surge.  Are we?

What do we need, what do we have—what do we lack?

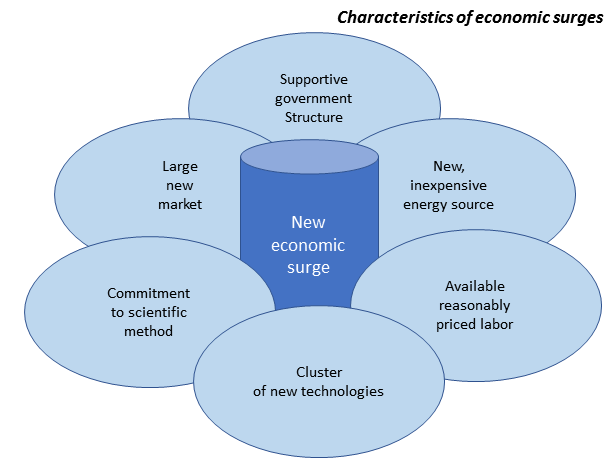
To answer this we can first note that previous economic surges shared several characteristics:

  • A cluster of new technologies that amplified each other and ultimately affected large segments of the economy—like automobiles and suburban housing growth after World War II.
  • A relatively inexpensive, new energy source—oil for the post-war boom.
  • A commitment to a scientific approach of applying technology along with a belief that improvements are both possible and desirable.
  • Available reasonably priced labor and a clear, large economic value—both resulting from the post-war baby boom.
  • A supportive government structure, like the Bretton Woods post-war conference that established the International Monetary Fund and the World Bank.
  • A large new market—like the auto-driven suburban build-out after World War II.

Characteristics of surges cropped v2

And we do have an unusually large and promising set of emerging technologies (as listed by the World Economic Forum) (21):

  • Self-driving vehicles.
  • Nano-sensors that can connect almost anything to anything else.
  • Perovskite solar cells that are lighter and cheaper than conventional solar cells.
  • New batteries that would make large-scale power storage possible.
  • Open artificial intelligence ecosystem.
  • Two-dimensional (super thin) materials.
  • Systems metabolic engineering, which gets chemicals from renewable micro-organisms.
  • Organs on a chip for medical testing.
  • Optogenetics, which uses light to control modified neurons.
  • The blockchain, which is a revolutionary decentralized trust system.

http://twoblokes.net/2017/07/25/objects-are-not-as-close-part-3